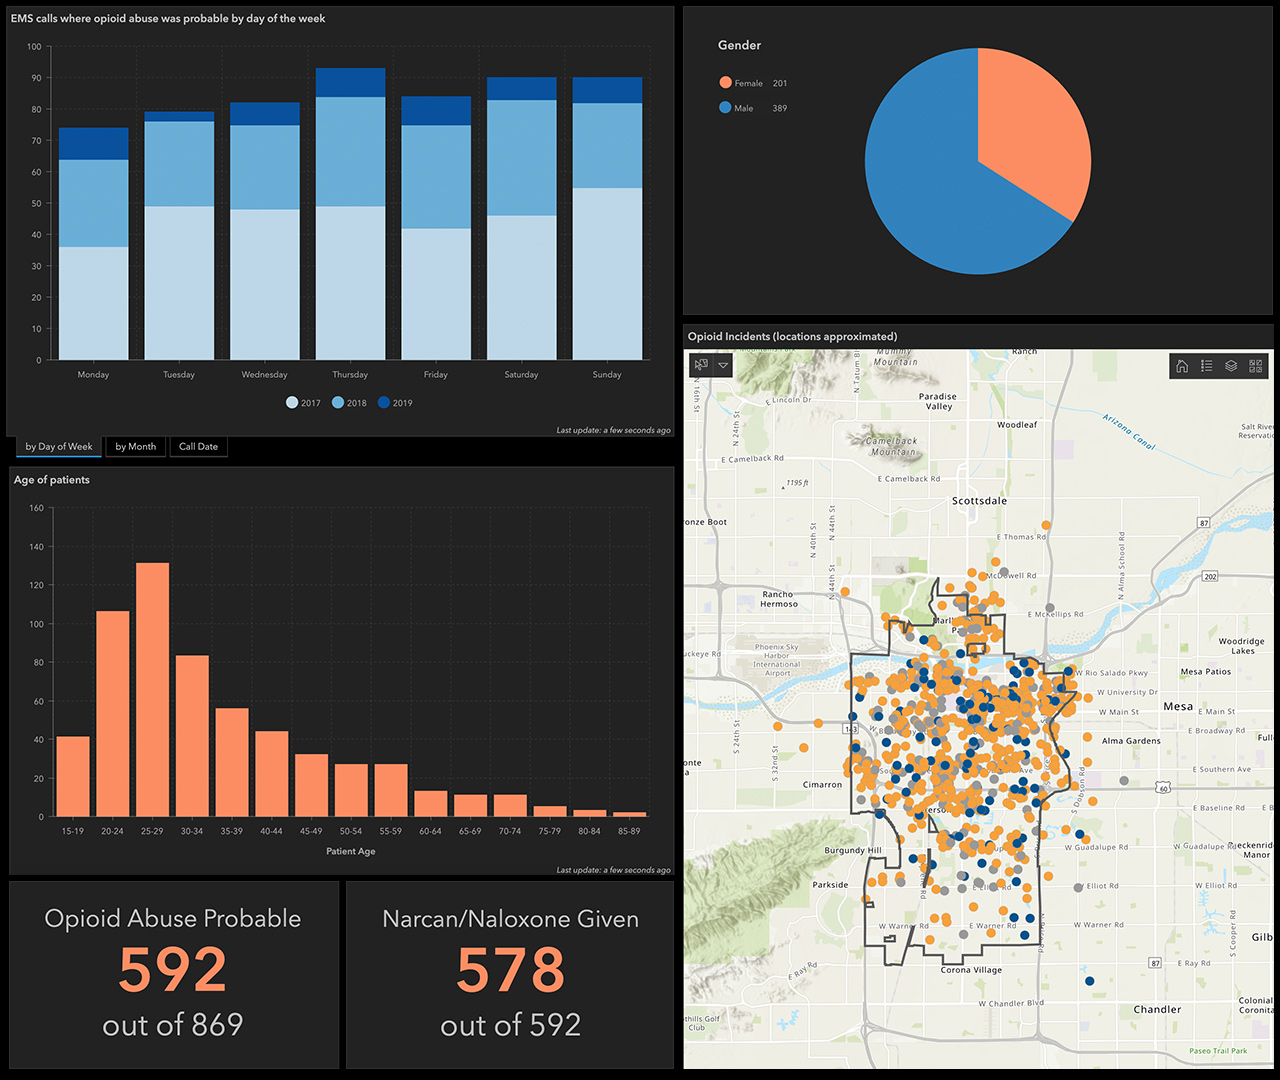
In the realm of data visualisation, ArcGIS Online Dashboards stand out as a powerful tool designed to bring geographic data to life. These dashboards are tailored for organisations and businesses that rely on spatial data to drive decision-making and operational strategies.
What Makes ArcGIS Online Dashboards Unique?
ArcGIS Online Dashboards offer a seamless integration of mapping and data visualisation, allowing users to monitor and analyse data in real-time, all within a geographic context. Here’s how:
-
Real-Time Data Integration: ArcGIS Online Dashboards allow you to incorporate real-time data feeds, offering live insights into ongoing events, asset tracking, and other critical operations. This feature is especially valuable for industries such as logistics, public safety, and environmental monitoring.
-
Interactive and Customisable Visuals: The dashboards are highly interactive, enabling users to create custom views that include maps, charts, gauges, and more. This interactivity ensures that you can drill down into the data to uncover specific trends and patterns that might be obscured in static reports.
-
Geospatial Analysis: What sets ArcGIS apart is its ability to blend spatial data with other datasets. This geospatial analysis provides a comprehensive understanding of how location impacts various factors, such as sales performance, resource allocation, and population trends.
Why Choose ArcGIS Online Dashboards?
For businesses and organisations that need to make informed decisions based on geographic data, ArcGIS Online Dashboards offer a robust solution. The platform’s ability to combine spatial data with non-spatial data provides a unique perspective that traditional BI tools may lack.
-
Enhanced Decision-Making: By visualising data on a map, you can better understand relationships and trends, leading to more informed and effective decision-making.
-
Improved Efficiency: Real-time updates and customisable dashboards allow for quick adjustments to strategies and operations, keeping your organisation agile and responsive.
-
User-Friendly Interface: Despite its powerful capabilities, ArcGIS Online Dashboards are designed with the user in mind. The platform is intuitive, allowing users with varying levels of technical expertise to build and interact with complex data visualisations.
Our Expertise in ArcGIS Online Dashboards
With extensive experience in ArcGIS Online, we can help you unlock the full potential of your geographic data. Whether you need a simple dashboard to track key metrics or a complex system that integrates multiple data sources, we have the expertise to create a solution tailored to your needs.
If you’re already using a BI tool, we can seamlessly integrate ArcGIS Online Dashboards into your existing setup. Or, if you’re new to data visualisation, we can guide you through the process of setting up a system that delivers actionable insights from day one.
ArcGIS Online Dashboards are more than just a visualisation tool; they are a gateway to deeper understanding and smarter decision-making. Whether you’re monitoring operations, analysing trends, or planning for the future, these dashboards provide the insights you need to succeed. Let us help you harness this powerful tool to transform your data into a strategic asset.


